

How To Create Infographics: Infographics are a visual illustration you can easily integrate into your reports and proposals.
They can make long, boring presentations fun and captivating.
If you don’t have the expertise to come up with infographics from scratch, Canva can help you.
The design platform makes it easy for anyone to create attractive and accurate infographics in minutes.
This article takes you through the step-by-step process.
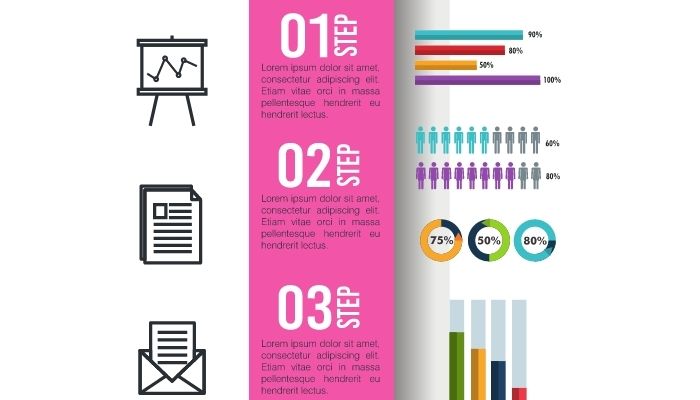
What do Infographics Look Like, and Should You Use Them?
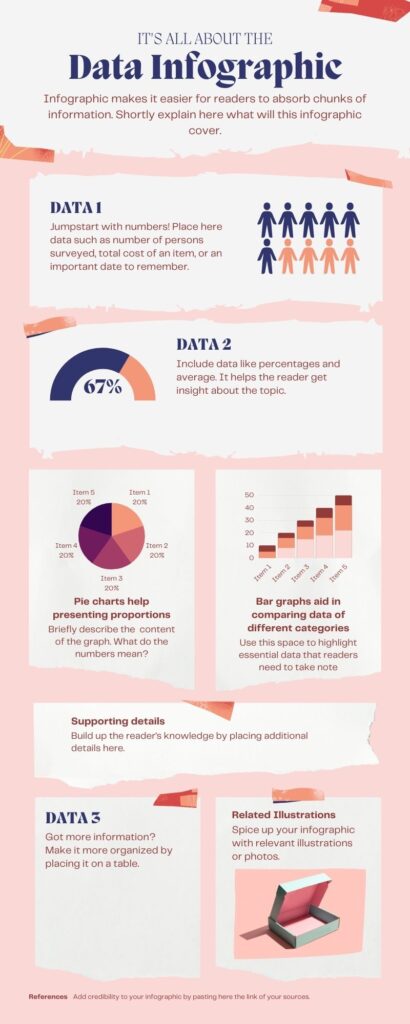
An infographic is a chart, usually very colourful, that is used to display facts, figures and statistics.
You may find pie charts, graphs, text, and illustrated images in an infographic chart.
Here’s an example:
Infographics are vital to many B2B marketers, hitting a 67% usage rate in 2020.
They are an easy, attractive way to transform ideas into amazing visual content sources.
They attract attention more easily because humans tend to be visual learners.
It’s a smart way to organize the bullet points of your article, presentation and similar documents.
How to Create Infographics with Canva
Canva is a popular design tool with a huge database of free-to-use templates, images and illustrations.
It also has pro resources, including templates, images and design elements you must pay for.
Many people are okay with using just the free stuff on Canva, but if you would like more exclusive and rich designs, you should go pro.
On Canva, you will find a collection of pre-built infographics in presentation styles and data types.
In addition to tools and inspiration, build yours from scratch.
Users can download infographics in any size and file format, including PDF, PNG, and JPG.
You can download the Canva app or go to canva.com to create your Infographics.
Step 1 – Organize your Data
To build an infographic, the first step is to organize information with clear and simple outlines.
Infographics deal with short, straightforward points; your data should be organized.

The process ensures that your content will fit in the infographic.
Write out the titles, headers, subheaders and the key takeaways of the content.
Consider the length of the lines and paragraphs and the best line presentation.
If you have too many words, then work on reducing them without losing your meaning.
Step 2 – Determine your Layout
Once your data is organized just right, you can move on to determine how best to present it.
If your data shows a sales increase over the last six months, for example, visual representations of that data could be helpful.

You can also use a text-focused layout to list problems and suggested solutions.
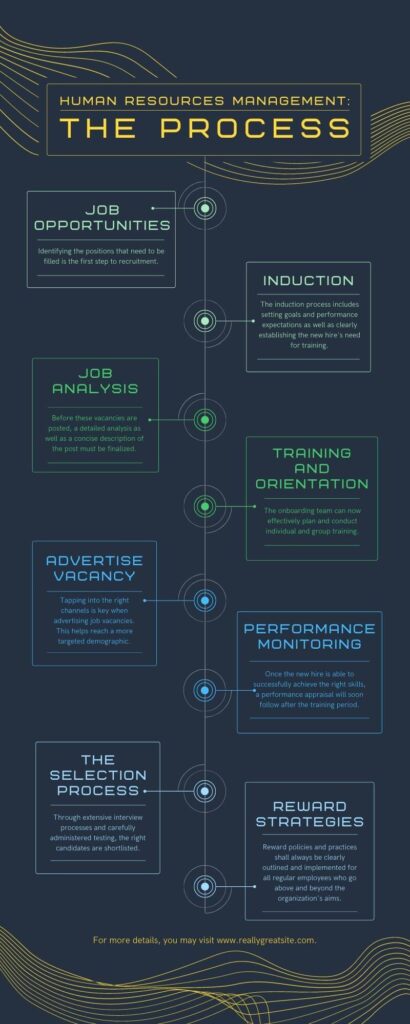
There might be a need to use many different elements of visual information representation.
Figuring out all that makes step 3 easier.
Step 3 – Choose a Template
In the search bar on Canva, type in “infographics”, and you’ll be presented with numerous samples.

These samples are editable templates that you can customize for your unique purposes.
There are thousands of free and paid infographics templates on Canva.
So you may narrow your search down to colour, theme or other specifications.
The idea of the layout you decided in step 2 should make this process less daunting.
Choose designs and colours that will enhance information delivery.
When you find a right template, you can proceed to step 4.
Step 4 – Customizing
Now for the fun part–making the template your own.
The awesome thing about Canva is its design flexibility.
You can manipulate any aspect of the template to suit your tastes.
You can add and remove icons, charts, graphs, images, etc.
Some templates have a resources page, so you don’t have to go too far looking for icons.
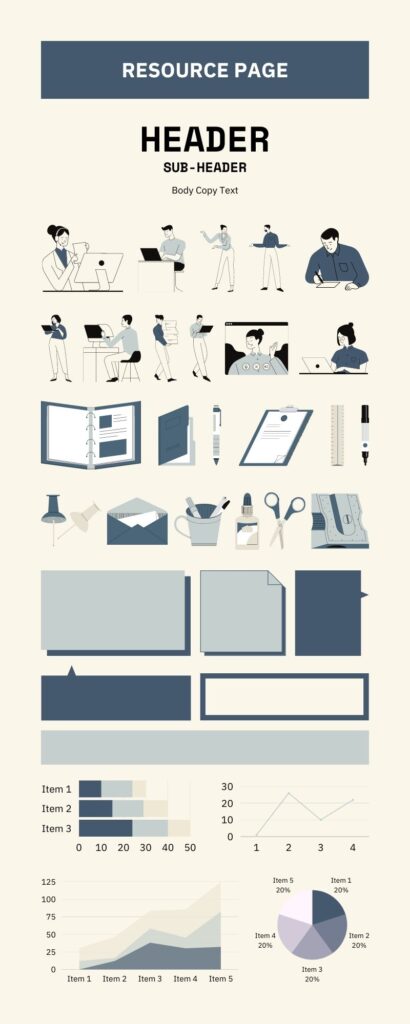
The perfect template is often not in a colour that works for you.
No worries, colours, just like text, can be easily adjusted.
If your brand has a colour theme, you could use that, but if not, find the best colours to appeal to your audience.
Here is a colour graph that can help you choose an infographic colour palette.
Step 5 – Save and Share
This last step is pretty simple.
You save your infographics in the format you want.
You can add infographics made on Canva to Word documents and PowerPoint presentations.
Or you may share them as images, files or links on your website.
Whatever you want to do, Canva infographics are versatile enough.
Tips for Creating Infographics
Use color psychology
People have intense psychological responses to colour.

People can express different emotions, thoughts, and actions when they see colours.
It’s called colour psychology; you can use it to make your infographics hit home.
When designing an infographic to present to a board of investors, you want to inspire trust.
In this scenario, you may incorporate blue or grey, associated with trustworthiness and stability.
It’s smart to use a colour associated with your information as well.
Like this green-themed infographic on succulent plants.

Use Appropriate Fonts
The language used in the infographic delivers a message, but so does the font.
The font has to be in line with the look and feel of the information on the infographics.
If the infographic is to present financial data to investors, a font that is too whimsical or graphics-based is not advisable.
On the other hand, if you’re celebrating one of your child’s milestones, using a traditional font like Times New Roman would feel too stuffy.

Use Only Necessary Elements
Don’t overcrowd your infographic with images, icons, text, etc.
It defeats the idea of easily digestible information.
Choose design elements if they help to convey information or are the information themselves.
Don’t add stuff just because it looks good.
Every element on your Infographic should serve a specific function.
Benefits of using Canva for infographics
You can Collaborate
Make your team’s Infographic easier to create using Canva.

Add the emails of your collaborators with the create a team button and work on your infographic design in real-time.
Switch Sizes
What if you made an infographic that’s simply perfect but not in the right sizes for all the platforms you need to put it on?
Canva allows you to resize your design with one click if you go pro.
Vast Graphics Library
Canva’s design library has over 2 million icons, photos, and illustrations.
There are many free ones, but even premium elements are available at an affordable price of $1.

Canva also allows you to import graphics outside the platform onto your infographics.
Final Words
You can make data beautiful and easy to digest with infographics.
Even if you are not a design expert, you can create astonishing infographic designs with Canva.
It’s as easy as picking and editing a template to represent your information.
If you keep it simple, Infographics will improve your brand’s visual appeal.
Try out Canva Pro for free below.